
Mastering Edge AI on NVIDIA Jetson: Real-Time Traffic Monitoring with DeepStream + TensorRT
From Jetson to Production – Real-Time AI at the Edge!

In this in-depth podcast episode, we dive into NVIDIA’s Edge AI Stack and show you how to build high-performance, production-ready AI applications on Jetson devices. Learn how to:
Set up your Jetson device using the JetPack SDK
Optimize deep learning models with TensorRT for real-time inference
Use Triton Inference Server for scalable, containerized deployment
Build real-time multi-camera pipelines with DeepStream SDK
Integrate monitoring with Nsight Systems, Prometheus, and Grafana
Deploy an end-to-end traffic monitoring system using Docker containers
Whether you're targeting smart cities, retail analytics, or industrial automation, this episode will equip you with the tools, strategies, and performance profiling methods needed to take your Edge AI applications to production.
👉 Subscribe for more expert podcasts on LLMs, LVMs, and cutting-edge AI!
#EdgeAIJetsonMastery
Mastering the NVIDIA Edge AI Stack: A Production-Level Guide to Jetson, DeepStream, TensorRT, and Triton
Introduction: From Edge AI Concepts to Production Reality
The proliferation of IoT devices and the demand for real-time, intelligent decision-making have catalyzed a paradigm shift in computing architecture. The traditional cloud-centric model, where data is sent to a centralized server for processing, often falls short when faced with the stringent requirements of latency-sensitive, data-intensive applications. This has given rise to the edge computing revolution, a model where AI computation is performed directly on or near the device where data is generated. The primary drivers for this shift are compelling: significantly reduced latency for real-time responses, enhanced data privacy and security by keeping sensitive information local, substantial reductions in bandwidth costs, and operational autonomy in environments with intermittent connectivity.
To empower developers to build and deploy sophisticated AI solutions in this new landscape, NVIDIA has created a comprehensive ecosystem of hardware and software. At the heart of this is the NVIDIA Metropolis platform, an application framework and partner ecosystem designed to simplify the development and scaling of vision AI applications from the edge to the cloud. Metropolis integrates a suite of powerful tools, including the DeepStream SDK for building real-time video analytics pipelines, the TAO Toolkit for model adaptation, and the Triton Inference Server for scalable model serving. These components are not disparate tools but are engineered to work in concert, providing a unified path to production.
This guide serves as a developer's definitive roadmap to mastering this powerful stack. It is designed for developers seeking to move beyond theoretical concepts and acquire the proven, hands-on experience necessary to build production-grade products. We will embark on a comprehensive journey, starting with the foundational hardware—the NVIDIA Jetson platform—and its software environment. We will then dive deep into the critical stages of a production AI workflow: optimizing models for peak performance with TensorRT, deploying them flexibly with Triton Inference Server, and constructing high-throughput, multi-camera pipelines with the DeepStream SDK. Finally, we will synthesize this knowledge into an end-to-end project, building a containerized, monitored, and scalable multi-camera traffic analysis system. This report will equip you not only with the "how-to" but, more importantly, the architectural "why," enabling you to build robust, efficient, and intelligent solutions for the edge.
Part 1: The Foundation - The NVIDIA Jetson Platform
The journey into edge AI development begins with the selection of a hardware platform capable of handling complex AI workloads within a constrained power and thermal envelope. The NVIDIA Jetson series of embedded computing boards stands as the leading platform for this purpose, designed specifically to accelerate machine learning applications in a compact, power-efficient form factor.
Anatomy of an Edge Supercomputer
The Jetson family has evolved through several generations, from the early Maxwell and Pascal architectures to the more recent Volta, and now to the state-of-the-art Ampere architecture, which powers the latest Jetson Orin series. For any new development, the Jetson Orin family—comprising the Orin Nano, Orin NX, and AGX Orin—is the recommended starting point, offering a significant leap in performance and efficiency.
These modules are complete Systems-on-Chip (SoCs) that integrate an ARM architecture CPU with a powerful NVIDIA GPU, making them ideal for running modern AI workloads. The key components that define their capabilities include:
GPU Architecture: The Orin series leverages the NVIDIA Ampere architecture, bringing dedicated Tensor Cores to the edge. These cores are specialized for the matrix operations at the heart of deep learning, providing orders-of-magnitude speedups for AI inference.
CPU: The high-performance ARM Cortex-A78AE CPU cores handle general-purpose computing tasks, operating system functions, and application logic.
Deep Learning Accelerators (DLA): In addition to the GPU, Orin NX and AGX Orin modules feature NVDLAs, which are fixed-function accelerators designed to offload inference tasks, freeing up the GPU for other parallel processing work.
Memory and Power: The modules offer a range of LPDDR5 memory capacities and configurable power modes, allowing developers to balance performance against the power budget of their specific application, from as low as 7W to 60W.
Choosing the right Jetson module is the first critical architectural decision a developer must make, as it directly constrains the potential scale and complexity of the application. The following table provides a consolidated comparison of the Jetson Orin series to aid in this selection process.

This comparison makes the trade-offs clear. An Orin Nano is an excellent, cost-effective choice for applications like smart cameras or entry-level AI IoT devices. An Orin NX provides a significant performance boost and DLAs, making it suitable for more demanding multi-stream analytics or advanced robotics. The AGX Orin is a powerhouse for applications requiring the absolute highest performance, such as autonomous machines or high-density sensor fusion.
The Brains of the Operation: JetPack SDK
The hardware is only half of the equation. Every Jetson module is powered by the NVIDIA JetPack SDK, a comprehensive software stack that unlocks the hardware's capabilities. JetPack bundles all necessary components into a single, easy-to-install package, providing a complete development environment for the edge. Its key components include:
Jetson Linux: A Board Support Package (BSP) that includes the Linux kernel (based on Ubuntu), bootloader, NVIDIA drivers, and a full desktop environment.
CUDA-X AI Stack: This is the core of the accelerated computing platform. It includes the CUDA toolkit for general-purpose GPU programming, as well as libraries like cuDNN (for deep neural network primitives) and, critically for this guide, NVIDIA TensorRT for high-performance inference.
Multimedia and Vision APIs: A collection of libraries and APIs that provide hardware-accelerated video and image processing, including encoding, decoding, and camera handling. These are the low-level components upon which DeepStream is built.
Jetson Platform Services: Introduced in JetPack 6, this is a collection of containerized, cloud-native services that simplify the development of production AI applications by providing ready-to-use modules for camera management, AI inference, and IoT connectivity.
Getting Started Right: A Production-Ready Setup (Jetson Orin with JetPack 6)
Setting up a Jetson developer kit correctly is the first step toward a stable and performant application. The following is a meticulous, step-by-step guide for bringing a new Jetson Orin Nano or Orin NX Developer Kit from an out-of-the-box state to being fully development-ready with the latest JetPack 6.
A common and significant hurdle for developers adopting JetPack 6 on Orin kits is the mandatory firmware update. Devices that shipped with older firmware or were previously running JetPack 5 are not directly compatible with JetPack 6. Attempting to boot a JetPack 6 SD card image on a device with outdated firmware will fail. The correct procedure is a non-obvious, multi-step process that involves temporarily using an older JetPack version to stage the necessary firmware update before proceeding with the new version. Adhering to this process is critical for a successful setup.
Step-by-Step Setup Guide:
Hardware & Software Prerequisites:
An NVIDIA Jetson Orin Nano or Orin NX Developer Kit.
A high-quality microSD card (UHS-1, 64GB or larger recommended).
A host computer (Windows, macOS, or Linux) with an SD card reader.
A USB keyboard, mouse, and a DisplayPort or HDMI monitor.
The official DC power supply included with the developer kit.
Balena Etcher software for flashing the SD card image.
The Critical Firmware Update Process:
Check Current Firmware: Before anything else, check the existing firmware version. To do this, power on the Jetson without an SD card inserted. Repeatedly press the
Esckey during boot to enter the UEFI setup menu. The firmware version will be displayed on the screen. If the version is older than 36.x, an update is required.Download JetPack 5.1.3: On your host computer, download the official JetPack 5.1.3 SD card image for the Jetson Orin Nano Developer Kit. This older image is used solely to trigger the firmware update.
Flash and Boot with JetPack 5.1.3: Use Balena Etcher to flash the JetPack 5.1.3 image to your microSD card. Insert the card into the Jetson and power it on. Proceed through the initial OEM configuration (language, user setup, etc.). The system will automatically run a background service to schedule the firmware update for the next reboot.
Reboot to Apply Firmware: After about 5 minutes, reboot the Jetson. During this boot cycle, the device will apply the new firmware.
Flashing and Booting JetPack 6:
Download JetPack 6: On your host computer, download the latest JetPack 6.x SD card image from the official NVIDIA page.
Flash with Etcher: Use Balena Etcher to flash this new JetPack 6.x image onto the same microSD card, overwriting the previous JetPack 5 image.
Insert and Boot: Insert the newly flashed card into the Jetson and power it on. The device will now boot into JetPack 6.
Initial Boot and System Configuration:
OEM Configuration: The first boot will guide you through the initial system setup again: accept the EULA, and configure your language, keyboard, time zone, username, password, and computer name.
Final Firmware Update: JetPack 6 itself may schedule one final bootloader update. It is good practice to reboot the device one more time after the initial setup is complete to ensure all components are finalized.
Post-Setup Verification and Component Installation:
Once you have logged into the Ubuntu desktop, open a terminal.
Run a system update and install the full
nvidia-jetpackmetapackage to ensure all SDK components (CUDA, cuDNN, TensorRT, etc.) are present and up to date.Bash
sudo apt update
sudo apt install nvidia-jetpack
Verify the installation using
jtop, a command-line tool that provides a comprehensive view of the system status, including library versions and hardware utilization. If not installed, you can install it withsudo -H pip install -U jetson-stats. Runningjtopshould now show the correct versions for JetPack, CUDA, cuDNN, and TensorRT.
Your Jetson Orin developer kit is now fully configured with the latest software and ready for production-level AI development.
Part 2: Achieving Peak Performance - Inference Optimization with TensorRT
Once the hardware foundation is in place, the next critical phase is optimizing the AI model for deployment. While deep learning frameworks like PyTorch and TensorFlow are indispensable for training and research, they include significant overhead that makes them suboptimal for high-performance inference, especially on resource-constrained edge devices. This is where NVIDIA TensorRT becomes essential. TensorRT is a high-performance deep learning inference optimizer and runtime library designed to deliver the lowest possible latency and highest throughput for AI applications running on NVIDIA GPUs. It is the key to unlocking the maximum performance from the Jetson's Ampere GPU and its Tensor Cores.
The TensorRT Deployment Workflow Demystified
The process of taking a model from a training framework to a deployable, optimized TensorRT engine follows a well-defined workflow. While there are framework-specific integrations (like Torch-TensorRT), the most common and versatile approach relies on the ONNX (Open Neural Network Exchange) format as a universal intermediate representation. This framework-agnostic path ensures maximum compatibility and is a cornerstone skill for any edge AI developer.
The workflow consists of four primary steps:
Export from Framework to ONNX: The first step is to export the trained model from its native framework into the ONNX format. For example, a YOLOv8 model trained in PyTorch (a
.ptfile) can be exported to a.onnxfile using the framework's built-in export functions. This ONNX file contains the network architecture and the learned weights in a standardized format.Select Target Precision: Before conversion, the developer must decide on the numerical precision for the final engine. The options are typically 32-bit floating-point (FP32), 16-bit floating-point (FP16), or 8-bit integer (INT8). This choice represents a crucial trade-off between performance and accuracy.
Convert ONNX Model to a TensorRT Engine: This is the core optimization step. A TensorRT tool, such as the
trtexeccommand-line utility or the TensorRT Python/C++ API, is used to parse the.onnxfile. TensorRT analyzes the model graph, applies numerous optimizations, and builds a runtime "engine." This engine is a highly optimized plan of execution that is tailored specifically to the target GPU architecture (e.g., the Ampere GPU in a Jetson Orin) and the chosen precision. The resulting artifact is typically saved as a.engineor.planfile.Serialize and Deploy: The optimized engine is serialized to a file for easy deployment. At runtime, the application loads this file, deserializes it into a TensorRT engine object, and uses the TensorRT runtime to execute inference, feeding input data and receiving predictions.
Under the Hood: Core Optimization Techniques
TensorRT's remarkable performance gains are not magic; they are the result of a suite of sophisticated, automated optimization techniques applied during the engine-building process. Understanding these techniques allows a developer to better reason about performance.
Layer & Tensor Fusion: This is one of the most impactful optimizations. TensorRT analyzes the network graph and vertically fuses sequential layers (e.g., a Convolution, a Bias addition, and a ReLU activation) into a single, combined kernel. It can also perform horizontal fusion on layers that take the same input tensor. This dramatically reduces memory bandwidth usage and kernel launch overhead, as data doesn't need to be written back to and read from global GPU memory between each small operation.
Precision Calibration: TensorRT leverages the specialized hardware in NVIDIA GPUs, particularly Tensor Cores, which provide massive speedups for lower-precision computations. It can automatically convert models to run in FP16 or INT8 precision. While FP32 is the standard for training, inference can often be performed with lower precision with minimal to no loss in accuracy, resulting in higher throughput and lower memory usage.
Kernel Auto-Tuning: For any given neural network layer, there may be multiple algorithmic implementations or kernels available. TensorRT profiles these different kernels on the specific target GPU during the engine build process and selects the fastest one for that particular hardware and for the specific parameters (like batch size and tensor dimensions) of the layer.
Dynamic Tensor Memory: To minimize the memory footprint, TensorRT performs aggressive memory optimization. It analyzes the entire network to understand the lifetime of each tensor and allocates memory for it only when it is actively needed, reusing memory buffers wherever possible.
The choice of precision is not merely a technical flag; it is a fundamental project decision that directly impacts the cost, performance, and capabilities of the final application. It requires a conscious balancing of throughput requirements against accuracy constraints. For many vision AI tasks, moving from FP32 to FP16 offers a substantial performance boost with negligible impact on accuracy, making it an easy choice. The move to INT8 can provide even greater speedups but requires an extra calibration step to maintain accuracy. This involves running a representative set of ~500-1000 unlabeled data samples through the model to determine the optimal quantization ranges.
The performance implications are significant. On a Jetson device, converting a YOLOv11s model from FP32 to FP16 can increase frames per second (FPS) from 68.5 to 126, and a further conversion to INT8 can push it to 168 FPS—a total increase of more than 2.4x. For a ResNet-50 model, a conversion to FP16 might yield a 6.4x speedup with only a 1% drop in accuracy. For a retail analytics application, doubling the number of cameras that can be processed on a single Jetson by accepting a tiny accuracy drop is an excellent engineering trade-off. For a safety-critical medical application, it might not be. An expert developer must understand how to make this choice and how to perform the necessary calibration steps.

Part 3: Scalable & Flexible Serving - The Role of Triton Inference Server
After optimizing a model into a high-performance TensorRT engine, the next challenge is deployment. For a simple application running a single, static model, one could load the engine directly into the application code. However, for production systems that demand flexibility, scalability, and manageability, a more robust solution is required. This is the role of the NVIDIA Triton Inference Server (formerly TensorRT Inference Server), an open-source inference serving software designed to streamline the deployment of AI models at scale.
Why a Dedicated Server at the Edge?
The idea of running a "server" on a resource-constrained edge device like a Jetson might seem counterintuitive. However, Triton is a lightweight, highly optimized C++ application, and its benefits directly address the complexities of real-world production deployments.
Dynamic Model Management: Triton allows models to be loaded, unloaded, and updated on the fly via a simple API call, without needing to restart the main application. This is crucial for deploying new model versions without service interruption.
Concurrent Model Execution: A single Triton instance can serve multiple different models simultaneously (e.g., a YOLOv8 for object detection and a ResNet for classification). Triton manages the scheduling of inference requests across these models, efficiently sharing the GPU resources.
Dynamic Batching: This is one of Triton's most powerful features. It can automatically intercept individual inference requests arriving from multiple, independent sources (like different camera streams in a DeepStream pipeline) and group them into a larger batch before sending them to the GPU. This maximizes the parallelism and efficiency of the GPU, significantly increasing overall throughput—a feature that is notoriously complex to implement correctly from scratch.
Standardized Interface: Triton exposes a standard set of HTTP/REST and gRPC endpoints for inference. This decouples the client application (like DeepStream) from the model backend, allowing them to be developed, updated, and scaled independently.
Multi-Framework Support: While this guide focuses on TensorRT, Triton can seamlessly serve models from PyTorch, TensorFlow, ONNX Runtime, and others, all from the same server instance. This provides immense flexibility for complex pipelines that might use models from different sources.
Architecting for Jetson
NVIDIA provides official Docker containers for Triton that are optimized for Jetson, making deployment straightforward. While most core features are available, it is important to note that as of recent releases, some advanced backends like the TensorRT-LLM backend are not yet supported in the Jetson Triton containers, reflecting the focus on vision AI and other traditional ML workloads at the edge.
The Model Repository: Your AI Model Library
Triton uses a simple but strictly defined directory structure, known as the model repository, to discover and load models. The application developer's primary interaction with Triton configuration is through this repository.
The structure is as follows:
model_repository/
└── <model_name>/
    ├── config.pbtxt
    └── 1/
        └── model.plan
<model_name>: The name that client applications will use to request inference from this model.config.pbtxt: A text file in Google's Protocol Buffer format that tells Triton everything it needs to know about the model.1/: A subdirectory representing the version number of the model. Triton supports versioning, allowing for A/B testing and seamless rollbacks.model.plan: The actual serialized model file. For a TensorRT engine, this is the.enginefile, which should be renamed tomodel.plan.
The config.pbtxt is the control center for the model. For a TensorRT engine, a minimal configuration would look like this:
Protocol Buffers
name: "yolov8_traffic"
platform: "tensorrt_plan"
max_batch_size: 8

input
  }
]
output
  }
]
The platform: "tensorrt_plan" directive is essential; it tells Triton to use its highly optimized TensorRT backend to execute the model. The
input and output blocks must precisely match the names, data types, and dimensions of the model's tensors.
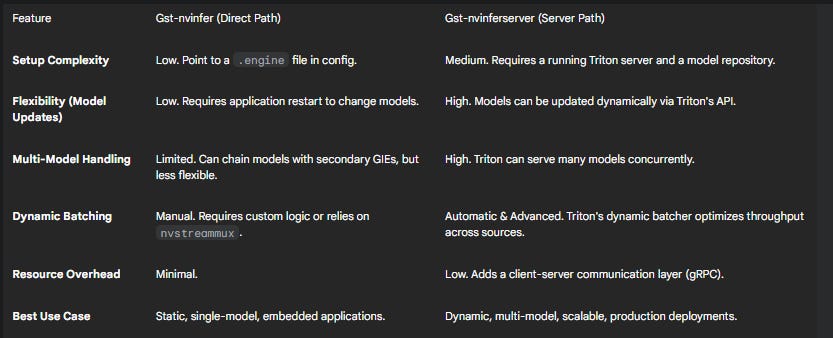
The most important architectural decision a DeepStream developer must make is how to perform inference. This choice is not just about performance but about the entire application's lifecycle, flexibility, and complexity. The decision is embodied in two mutually exclusive GStreamer plugins: Gst-nvinfer and Gst-nvinferserver.
The Gst-nvinfer plugin represents the direct path. It loads a serialized TensorRT engine file directly from disk into the DeepStream pipeline. This approach is simple, has minimal overhead, and is perfectly suited for applications with a single, static model that is not expected to change frequently. The application is tightly coupled to the model file specified in its configuration.
Conversely, the Gst-nvinferserver plugin represents the server path. It does not load a model file itself; instead, it acts as a client that forwards inference requests to a running Triton Inference Server. This introduces a client-server architecture, which adds some initial setup complexity but provides immense production-level benefits. It decouples the DeepStream application from model management, allowing models to be updated, added, or removed in Triton without touching or restarting the DeepStream pipeline. This is the path for dynamic, scalable, and multi-model applications. Choosing the right plugin is a fundamental design choice that dictates the application's operational capabilities.
Part 4: Building Real-Time Vision Pipelines - The DeepStream SDK
With an optimized model ready for serving, the next step is to build the application that processes real-time video streams and feeds them to the model for inference. The NVIDIA DeepStream SDK is the primary tool for this task. It is a complete streaming analytics toolkit for building high-performance, AI-powered video, audio, and image understanding applications.
At its core, DeepStream is built upon the open-source GStreamer multimedia framework. GStreamer allows developers to construct complex media processing pipelines by linking together a series of modular elements, or plugins. DeepStream extends GStreamer with a rich set of hardware-accelerated plugins that leverage the full power of the Jetson platform's dedicated engines for video decoding, scaling, color conversion, and, most importantly, AI inference.
The Building Blocks of a DeepStream App
A typical DeepStream application is a GStreamer pipeline composed of several key plugins, each performing a specific task in a sequential data flow :
Source (
uridecodebinornvurisrcbin): This is the entry point of the pipeline. It takes an input URI—which can be an RTSP stream from an IP camera, a local video file, or a direct camera input (like CSI or USB)—and decodes the compressed video into raw video frames.Stream Muxer (
nvstreammux): This is a crucial component for multi-stream applications. It collects raw video frames from multiple source plugins and combines them into a single batched buffer. Batching is essential for maximizing the parallelism of the GPU during inference, as it allows the model to process multiple frames in a single pass.Inference (
nvinferornvinferserver): This plugin takes the batched frames from the muxer and performs AI inference. As discussed in Part 3, developers choose betweennvinferfor direct TensorRT engine loading ornvinferserverto communicate with a Triton Inference Server. The plugin attaches the inference results (e.g., bounding boxes, class labels, confidence scores) as metadata to the buffer.Tracker (
nvtracker): After detection, the tracker plugin analyzes the metadata across consecutive frames. It assigns a unique ID to each detected object and tracks its movement through the scene. This is vital for applications that need to understand object behavior over time, rather than just performing single-frame detection.On-Screen Display (
nvdsosd): This plugin reads the metadata attached by the inference and tracker plugins and renders it visually onto the video frames. It can draw bounding boxes, text labels, tracking trails, and other custom information, which is invaluable for debugging and visualization.Sink (
nveglglessink, RTSP Sink, etc.): This is the final element in the pipeline. It takes the processed and annotated video frames and outputs them. Thenveglglessinkrenders the output to a connected display, while an RTSP sink can re-stream the processed video over the network for remote viewing.
Mastering the Triton Integration (gst-nvinferserver)
To build a production-grade application that leverages the flexibility of Triton, mastering the gst-nvinferserver plugin is key. This plugin acts as the bridge, connecting the GStreamer-based DeepStream world to the Triton model serving world.
The communication between gst-nvinferserver and the Triton server happens over gRPC, a high-performance remote procedure call framework. The plugin's behavior is controlled through a dedicated configuration file, which uses Google's Protocol Buffer text format (
.prototxt).
When configuring the plugin to connect to a Triton server running locally on the same Jetson device, several parameters are critical:
gRPC URL: The configuration must specify the address and port of the Triton server's gRPC endpoint. This is done within the
infer_configblock of the prototxt file. For a local server, this is typically set tourl: "localhost:8001".CUDA Buffer Sharing: The
enable_cuda_buffer_sharingparameter is a performance optimization that allows the plugin to share GPU memory buffers directly with the Triton server, avoiding a costly data copy from GPU to CPU and back. However, the official documentation explicitly states that this feature is supported on dGPU platforms but not on Jetson devices. Therefore, for any Jetson deployment, it is crucial to setenable_cuda_buffer_sharing: false. Overlooking this detail is a common source of errors and instability.Model Repository: The DeepStream application must be aware of the model repository that the Triton server is using. While the plugin itself doesn't load models, it needs to know which model to request from Triton, and this model must be available in the server's repository.
By correctly configuring these parameters, the gst-nvinferserver plugin seamlessly integrates the DeepStream pipeline with the powerful serving capabilities of Triton, enabling the creation of dynamic, scalable, and maintainable edge AI applications.
Part 5: End-to-End Project - Building a Multi-Camera Traffic Monitoring System
This section synthesizes the concepts from the previous parts into a tangible, production-level project. We will walk through the complete process of building, containerizing, and deploying a multi-camera traffic monitoring application on a Jetson Orin device. This system will ingest multiple real-time RTSP camera streams, use a TensorRT-optimized YOLOv8 model served by Triton to detect vehicles, and provide an annotated output stream.
5.1. The Architectural Blueprint
Before writing any code, it is essential to have a clear architectural plan. Our system will be a multi-container application orchestrated by Docker.
Inputs: Multiple RTSP streams from IP cameras.
Containers:
Triton Inference Server Container: Runs the official Triton server image for Jetson. It will be responsible for loading the TensorRT-optimized YOLOv8 model from a mounted volume and serving it via its gRPC endpoint.
DeepStream Application Container: Runs our custom DeepStream application. This container will ingest the RTSP streams, use the
gst-nvinferserverplugin to send inference requests to the Triton container, process the results, and output an annotated video stream.
Communication: The DeepStream and Triton containers will communicate over a shared Docker network using gRPC.
Outputs: A single, tiled RTSP stream showing the annotated video from all cameras.
This containerized, microservices-style architecture provides isolation, portability, and scalability, which are hallmarks of a production-grade system.
5.2. The Production Environment with Docker
For any serious deployment, containerization is non-negotiable. It encapsulates the application and all its dependencies, ensuring that it runs consistently across different environments, from development to production.
Crafting the Dockerfile for the DeepStream Application: We will use a multi-stage Dockerfile to create an optimized and lean runtime image.
Dockerfile
# Stage 1: Build Environment
# Use the full development image that includes build tools and libraries
FROM nvcr.io/nvidia/deepstream:7.1-triton-multiarch AS builder

# Install any build-time dependencies, e.g., for custom parsers
# RUN apt-get update && apt-get install -y build-essential cmake

# Copy application source code
COPY. /app/
WORKDIR /app

# Compile any custom components if necessary
# RUN make -C custom_parser/

# Stage 2: Runtime Environment
# Use the same base image, but we will only copy necessary artifacts
FROM nvcr.io/nvidia/deepstream:7.1-triton-multiarch

WORKDIR /opt/nvidia/deepstream/deepstream-7.1/sources/apps/sample_apps/deepstream-traffic-app/

# Install runtime dependencies that might be missing from the base image
# E.g., ffmpeg is often needed for certain codecs
RUN apt-get update && apt-get install --reinstall -y libflac8 libmp3lame0 libxvidcore4 ffmpeg

# Copy the application files, configs, and the compiled model
COPY --from=builder /app/traffic_app.py.
COPY --from=builder /app/configs/ /app/configs/
COPY --from=builder /app/models/ /app/models/
# COPY --from=builder /app/custom_parser/libcustomparser.so.

# Set the entrypoint for the container
ENTRYPOINT ["python3", "traffic_app.py"]
This approach ensures the final image contains only what is needed to run the application, reducing its size and attack surface. When running Docker on Jetson, it is critical to use the
--runtime nvidia flag to grant the container access to the host's GPU and other NVIDIA hardware accelerators.
Orchestration with Docker Compose: To manage our two-container system, we will use a docker-compose.yml file. This allows us to define and launch the entire application stack with a single command.
YAML
version: '3.8'
services:
  triton-server:
    image: nvcr.io/nvidia/deepstream:7.1-triton-multiarch # This image contains Triton
    command: tritonserver --model-repository=/models
    runtime: nvidia
    ports:
      - "8000:8000" # HTTP
      - "8001:8001" # gRPC
      - "8002:8002" # Metrics
    volumes:
      -./model_repository:/models
    networks:
      - ai_network

  deepstream-app:
    build:.
    runtime: nvidia
    depends_on:
      - triton-server
    environment:
      - DISPLAY=:0
    volumes:
      - /tmp/.X11-unix:/tmp/.X11-unix
    networks:
      - ai_network

networks:
  ai_network:
5.3. Model Deployment Pipeline
Convert YOLOv8 to TensorRT: First, convert a pre-trained YOLOv8 PyTorch model (
.pt) to ONNX. Then, use thetrtexeccommand-line tool, which is part of the JetPack installation, to convert the ONNX file into an optimized TensorRT engine. We will target FP16 precision for a good balance of speed and accuracy.Bash
# Step 1: Export to ONNX (using Ultralytics package)
# yolo export model=yolov8n.pt format=onnx dynamic=True

# Step 2: Convert ONNX to TensorRT engine
trtexec --onnx=yolov8n.onnx \
        --saveEngine=yolov8n_fp16.engine \
        --fp16
This process creates a
yolov8n_fp16.enginefile optimized for the Jetson Orin GPU.Set up Triton Repository: Create the required directory structure and
config.pbtxtfile.Create directories:
mkdir -p model_repository/yolov8_traffic/1Move and rename the engine:
mv yolov8n_fp16.engine model_repository/yolov8_traffic/1/model.planCreate
model_repository/yolov8_traffic/config.pbtxtwith the correct platform (tensorrt_plan), input/output names, data types, and dimensions.
Launch Triton: The
docker-compose.ymlfile handles this. When launched, Triton will automatically scan the/modelsdirectory (which is mapped to our localmodel_repository) and load the YOLOv8 model.
5.4. The DeepStream Application in Python
The core logic resides in the traffic_app.py script, which uses DeepStream's Python bindings to construct and run the GStreamer pipeline. The application's behavior is primarily defined by a text configuration file.
Multi-Camera RTSP Configuration: A common challenge is correctly configuring the application for multiple input streams. This is handled in the main DeepStream configuration file by defining multiple [source#] groups and setting the num-sources property in the [application] group.

Configuring gst-nvinferserver: The [primary-gie] group points to a separate configuration file (pgie_triton_config.txt). This file, in prototxt format, tells the nvinferserver plugin how to connect to Triton.
Protocol Buffers
infer_config {
  unique_id: 1
  backend {
    triton {
      model_name: "yolov8_traffic"
      grpc {
        url: "triton-server:8001" # Use Docker Compose service name
        enable_cuda_buffer_sharing: false # CRITICAL for Jetson
      }
    }
  }
  #... other settings like preprocessing...
}
Note the use of the Docker Compose service name triton-server in the URL, which Docker's internal DNS will resolve to the correct container IP.
Extracting Insights with Pad Probes: To make the application useful, we need to access the inference results. This is done by attaching a Python callback function, known as a "pad probe," to a GStreamer pad in the pipeline. A good place is the sink (input) pad of the nvdsosd element, as all metadata is available at this point.
Python
# In traffic_app.py
import pyds

def osd_sink_pad_buffer_probe(pad, info, u_data):
    gst_buffer = info.get_buffer()
    if not gst_buffer:
        return Gst.PadProbeReturn.OK

    batch_meta = pyds.gst_buffer_get_nvds_batch_meta(hash(gst_buffer))
    l_frame = batch_meta.frame_meta_list
    while l_frame is not None:
        try:
            frame_meta = pyds.NvDsFrameMeta.cast(l_frame.data)
        except StopIteration:
            break

        vehicle_count = 0
        l_obj = frame_meta.obj_meta_list
        while l_obj is not None:
            try:
                obj_meta = pyds.NvDsObjectMeta.cast(l_obj.data)
                # Assuming class_id for 'car' is 2, 'truck' is 7, etc.
                if obj_meta.class_id in :
                    vehicle_count += 1
            except StopIteration:
                break
            l_obj = l_obj.next

        print(f"Frame {frame_meta.frame_num} on Stream {frame_meta.source_id}: Found {vehicle_count} vehicles.")

        l_frame = l_frame.next
    return Gst.PadProbeReturn.OK

#... in pipeline setup...
osdsinkpad = nvdsosd.get_static_pad("sink")
if osdsinkpad:
    osdsinkpad.add_probe(Gst.PadProbeType.BUFFER, osd_sink_pad_buffer_probe, 0)
This probe function iterates through the metadata for each frame in the batch, counts objects of interest, and prints the results. This is where custom business logic, such as triggering alerts or sending data to a dashboard, would be implemented.
5.5. System Launch
With the Dockerfile and docker-compose.yml in place, launching the entire distributed application is as simple as running one command from the project's root directory: docker-compose up --build -d
This command will build the DeepStream application image, pull the Triton image, and start both containers in the background. The system is now live, processing multiple camera streams and performing high-performance, flexible AI inference at the edge.
Part 6: Production-Grade Operations - Profiling & Monitoring
Deploying an application is not the end of the journey. For a system to be considered production-grade, it must be observable and maintainable. This requires robust tools for performance profiling to identify and eliminate bottlenecks, and continuous monitoring to ensure long-term stability and health.
6.1. Finding the Bottlenecks: Performance Profiling
An application that simply "works" is often far from "optimized." Achieving maximum performance on a Jetson device requires a systematic approach to identifying bottlenecks.
High-Level Analysis: The first step is a quick health check using command-line tools on the Jetson device itself. The jtop utility (a user-friendly wrapper for the underlying tegrastats tool) provides a real-time dashboard of system resource utilization. By running jtop in a terminal while the DeepStream application is active, a developer can get an immediate sense of the load on the CPU cores, GPU, and memory, as well as the device's temperature and power consumption. This is useful for spotting obvious issues, like a maxed-out CPU or an underutilized GPU.
Deep Dive with NVIDIA Nsight Systems: For true, in-depth analysis, a more powerful tool is needed. NVIDIA Nsight Systems is a system-wide performance analysis tool that provides detailed, synchronized timeline views of everything happening across the CPU and GPU. It is the definitive tool for understanding the intricate interactions within a complex application like DeepStream and pinpointing subtle performance limiters.
Profiling a Jetson application with Nsight Systems involves a host-target setup: the Nsight Systems GUI runs on a separate x86 Linux host computer, which connects to the Jetson device over the network to collect profiling data.
Step-by-Step Nsight Systems Profiling:
Setup: Install NVIDIA SDK Manager on an x86 host machine. Use it to install the Nsight Systems profiler. In the Nsight Systems GUI, configure a new connection to the Jetson device by providing its IP address and login credentials.
Execution: From the Nsight GUI on the host, you can remotely launch the application on the Jetson under the profiler. The command line would look something like this:
Bash
nsys profile --trace=cuda,cudnn,cublas,osrt,nvtx -o report.nsys-rep python3 traffic_app.py
This command traces a wide range of events, including CUDA API calls, kernel executions, OS runtime libraries, and NVTX (NVIDIA Tools Extension) ranges, which are custom markers that DeepStream and other SDKs use to label their internal phases.
Analysis: Once the profiling run is complete, the
report.nsys-repfile is opened in the Nsight Systems GUI. The resulting timeline allows a developer to visualize the entire application's execution second by second, microsecond by microsecond. One can see the GStreamer threads on the CPU, the moments when they submit work to the GPU, the execution of CUDA kernels and TensorRT inference passes on the GPU timeline, and the activity of specialized hardware like the video decoders. This makes it possible to answer critical performance questions: Is the GPU waiting for the CPU to feed it data? Is there a bubble in the pipeline where no component is doing useful work? Is a specific plugin taking longer than expected? This level of detail is essential for moving beyond simple FPS measurements and achieving true system optimization.
6.2. Keeping an Eye on Inference: Monitoring with Prometheus & Grafana
While profiling is for deep, offline analysis, production systems require continuous, real-time monitoring. For this, a combination of Prometheus (a time-series database and alerting toolkit) and Grafana (a visualization and dashboarding tool) is the industry standard.
A significant production-ready feature of Triton Inference Server is its built-in support for observability. By default, Triton exposes a rich set of performance and utilization metrics at a /metrics HTTP endpoint in the Prometheus exposition format. This means developers do not need to write any custom instrumentation code to monitor their model serving; Triton provides it out of the box. The metrics include detailed counters and histograms for inference requests, execution counts, queue times, and compute times, as well as GPU utilization and memory usage. This built-in capability is a massive accelerator for building manageable, production-grade AI services.
Step-by-Step Monitoring Setup:
Run Prometheus: We will add a Prometheus service to our
docker-compose.ymlfile. This service will run the official Prometheus Docker image.Configure Prometheus: We will create a
prometheus.ymlconfiguration file and mount it into the Prometheus container. This file will contain a "scrape configuration" that tells Prometheus to periodically fetch metrics from the Triton container's metrics endpoint (triton-server:8002).YAML
# prometheus.yml
scrape_configs:
  - job_name: 'triton'
    static_configs:
      - targets: ['triton-server:8002']
Run and Configure Grafana: Similarly, we will add a Grafana service to our
docker-compose.yml.Create a Dashboard: Once all services are running (
docker-compose up), we can access the Grafana web UI (typically at
http://localhost:3000
). Inside Grafana, we will:
Add a new "Data Source" and point it to the Prometheus service (
http://prometheus:9090
).
Create a new dashboard. Using Grafana's query builder, we can create panels to visualize the key metrics from Triton. While community dashboards exist and are a good starting point , a custom dashboard tailored to our traffic application is most effective. Key metrics to visualize include:
Inference Throughput: The rate of successful inference requests (
rate(nv_inference_request_success_total[5m])).Inference Latency: The P95 or P99 latency, which can be broken down into queue duration and actual compute duration (
histogram_quantile(0.95, sum(rate(nv_inference_queue_duration_us_bucket[5m])) by (le))).GPU Utilization: The percentage of time the GPU is active (
nv_gpu_utilization).Average Batch Size: A critical indicator of efficiency, calculated as
rate(nv_inference_count_total[5m]) / rate(nv_inference_exec_count_total[5m]).
With this monitoring stack in place, operators have a real-time view into the health and performance of the AI inference core of their application, enabling proactive maintenance and capacity planning.
Conclusion: Your Path to Becoming an Edge AI Expert
This comprehensive guide has charted a course from foundational principles to the deployment of a sophisticated, production-grade edge AI system. By progressing through each stage, a developer gains not just procedural knowledge but a deep architectural understanding of the NVIDIA edge AI stack. We began by establishing the hardware foundation, learning to select and prepare the appropriate NVIDIA Jetson Orin module for a given task, navigating the critical initial firmware and JetPack SDK setup. From there, we delved into the essential practice of performance optimization, transforming a standard trained model into a highly efficient TensorRT engine, and critically analyzing the trade-offs between speed and precision.
We then explored the flexible and scalable deployment paradigm offered by the Triton Inference Server, understanding its role in managing models and maximizing GPU utilization in dynamic, real-world scenarios. This led to the core of the application: building a real-time, multi-camera pipeline using the DeepStream SDK, and mastering the integration between DeepStream and Triton. The end-to-end traffic monitoring project synthesized these skills, demonstrating how to assemble the components into a cohesive, containerized application orchestrated with Docker. Finally, we addressed the crucial "day two" operational challenges of profiling and monitoring, using professional-grade tools like NVIDIA Nsight Systems, Prometheus, and Grafana to ensure the application is not only functional but also performant, robust, and observable.
The key skills unlocked through this journey are the cornerstones of modern edge AI development:
Hardware and Software Setup: Confidently preparing a Jetson device for production development.
Inference Optimization: Systematically converting and optimizing models with TensorRT.
Scalable Serving: Architecting flexible model deployment strategies with Triton Inference Server.
Real-Time Pipeline Construction: Building complex, multi-stream analytics pipelines with DeepStream.
Containerization and Orchestration: Packaging and deploying applications for portability and manageability using Docker.
Production Monitoring and Profiling: Analyzing and ensuring the performance and stability of deployed systems.
Ultimately, the power of the NVIDIA ecosystem lies in the seamless integration between these components. The ability to move from a Jetson hardware platform, through a JetPack-enabled software environment, to a TensorRT-optimized model, served by Triton and consumed by a DeepStream pipeline, represents a unified and highly accelerated path from concept to deployment. This integrated stack empowers developers to build intelligent vision AI and robotics solutions that would be orders of magnitude more complex and less performant if attempted with a collection of disparate, non-optimized tools. With the knowledge presented here, developers are now well-equipped to tackle the challenges of edge AI and build the next generation of intelligent machines. For those looking to expand their expertise further, exploring the NVIDIA TAO Toolkit for low-code model training, the broader Metropolis Microservices for pre-built application components, and the NVIDIA Isaac SDK for advanced robotics are excellent next steps.